Application teams were noticing intermittent latency spikes; CloudWatch had the raw RDS metrics but nobody was looking at them, and slow queries were buried in MySQL slow-query logs that engineers had to SSH into the RDS instance and grep through. Mean time to identify which query caused last week's outage: hours.
The challenge
Build a serverless monitor that watches RDS CPU, connection, and I/O metrics, surfaces top slow queries to engineers in real time, and emails a digest of the worst offenders — without requiring anyone to log into the RDS console or SSH into a host.
Approach
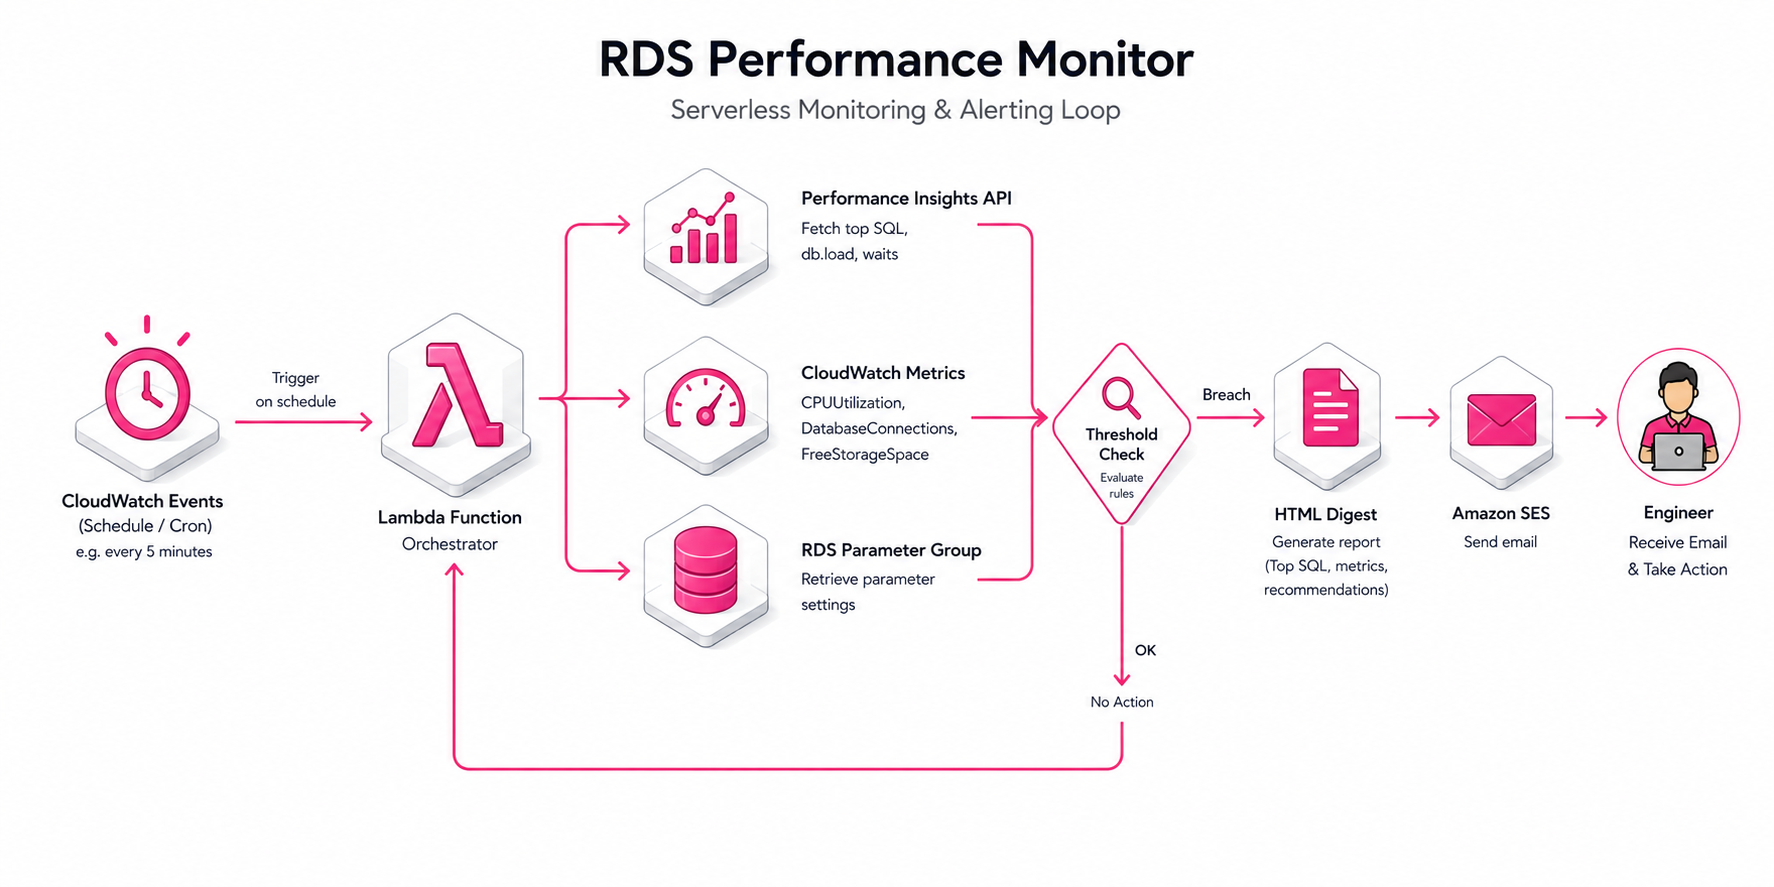
AWS Lambda runs on a CloudWatch Events schedule. On each tick it queries RDS Performance Insights for top-N slow queries by total execution time, joins those against CloudWatch CPU + connection-count metrics for the same window, and applies threshold logic. If thresholds breach, the Lambda builds an HTML digest and emails it via Amazon SES to the on-call distribution list. The Lambda also has authority to flip the slow-query log on or off via the RDS parameter group — useful when a regression is in flight and engineers want more detail temporarily without paying the storage cost permanently.
Performance Insights API returns structured top-SQL results — execution count, average latency, total wait time, plan hint. No log parsing required.
Threshold logic uses percentile-based comparison (p95 of last 24h) rather than absolute values — reduces false positives during legitimate spikes like morning ETL.
Digest is HTML-formatted via SES so engineers see formatted top-N tables in their inbox, not a JSON blob.
Dynamic slow-query log toggle: when CPU breaches threshold, the Lambda calls ModifyDBParameterGroup with slow_query_log=1 for the next monitoring window, then disables it on the following tick. Avoids permanent log storage.
All Lambda IAM permissions are scoped down to specific RDS instance ARNs and a single SES sender identity — least-privilege, auditable.
Architecture
A scheduled Lambda fans out to two metric sources, applies threshold logic, builds a digest, and pages humans via email. No persistent infrastructure beyond the Lambda itself.
Workflow diagram
01
Scheduled tick
CloudWatch Events fires on a configurable schedule (every 5 / 15 / 60 min) and invokes the monitoring Lambda.
02
Pull top SQL via Performance Insights
DescribeDimensionKeys on the db.sql.tokenized_id dimension returns the top-N slow queries by total execution time for the last window, with average latency, execution count, and plan info.
03
Pull CloudWatch metrics
GetMetricData fetches CPUUtilization, DatabaseConnections, ReadIOPS, WriteIOPS for the same window — context for whether the slow queries are causing or being caused by load.
04
Threshold evaluation
Percentile-based comparison against the last 24h baseline. A query that's slow because the DB is generally under load reads differently than a query that's pathologically slow on a quiet DB.
05
Build digest, optionally enable slow log
If thresholds breach, build an HTML digest of the top offenders. Optionally call ModifyDBParameterGroup to enable slow_query_log for the next window — gives engineers more detail without paying log storage permanently.
06
Email via SES
SendEmail with the formatted HTML body to the on-call distribution list. Engineers see structured top-N tables, not raw log blobs.
Engineering decisions
Why Performance Insights, not slow-query log parsing
Performance Insights is structured: every entry has tokenized SQL, execution count, average latency, total wait time, plan hint. Slow-query log is unstructured text that requires regex parsing and is brittle to MySQL version differences. PI is the right interface for programmatic consumption.
Why percentile-based thresholds, not absolute
Absolute thresholds (e.g., 'alert if CPU > 80%') generate false positives during legitimate spikes like morning ETL or end-of-month batch jobs. Percentile-based thresholds (e.g., 'alert if p95 of last hour > p95 of last 24h * 2') catch genuine regressions and ignore expected spikes.
Why dynamic slow-query log toggle
Slow-query logging at full volume is expensive — log storage cost grows linearly with traffic. Toggling logging on for the next monitoring window only when a regression is in flight gives engineers the detail they need without committing to the permanent log-storage bill.
Why SES email, not SNS or Slack webhook
Engineers triage from email; the digest needs structured HTML (top-N tables, query text, latency stats). SES handles formatted HTML cleanly. SNS is short-text-only; Slack would work but adds an integration dependency for a reporting workflow that should survive infrastructure changes.
Impact
Engineers see slow-query offenders within minutes of a regression instead of finding out from a customer ticket. Mean time to identify a regression dropped from hours to single-digit minutes. Memory and I/O optimization moved from reactive (after the customer complains) to proactive (we already have the digest).